Movie Duration Trend Analysis (using Netflix dataset)
In this article, we would make simple research on whether or not movie duration decreasing. So, is the movie duration getting shorter now? Or is it otherwise? Let’s find out!

Movies are a type of entertainment people love to have in their spare time. Over few decades, movies are getting more and more consumed as accessibility is much better and easier now. And as technology is getting better over time, the movie industry has grown its quality as well. However, the making process is getting much more complex either. Would the more difficult movie-making process impact the movie duration from then to now? Let’s do some simple research on it!
First, load the Netflix CSV dataset and store its value in a data frame called durations_df. Print the first 5 data of durations_df using the head() function to get a glimpse of it.
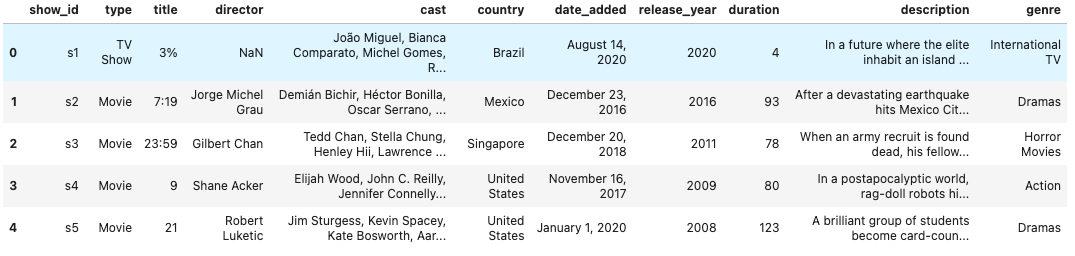
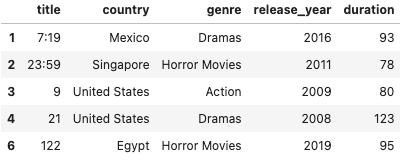
As you can see, there are a lot of columns on the dataset. We need to filter the columns to only those needed for analysis to make it more efficient. In this case, we only need ‘title’, ‘country’, ‘genre’, ‘release_year’, and ‘duration’.
To get a look at the spread of the data, we visualize each movie and its duration based on its release year. From the plot, we can see there are more movies created in recent decades and the durations get more diverse.
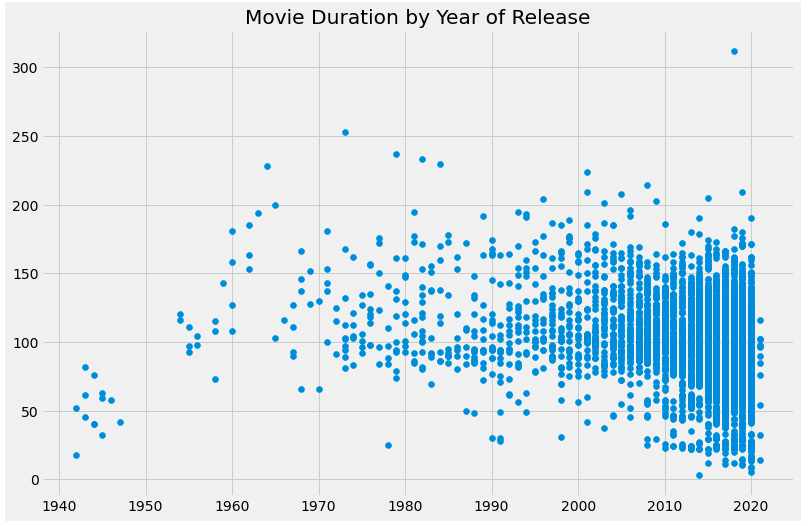
From the previous plot, we can see there are a lot of movies in recent decades and there are way more movies with shorter duration as well. This can be overrepresented. To get a more appropriate analysis, we need to dive deeper into it and see which genre movies with a duration of fewer than 60 minutes fall into.
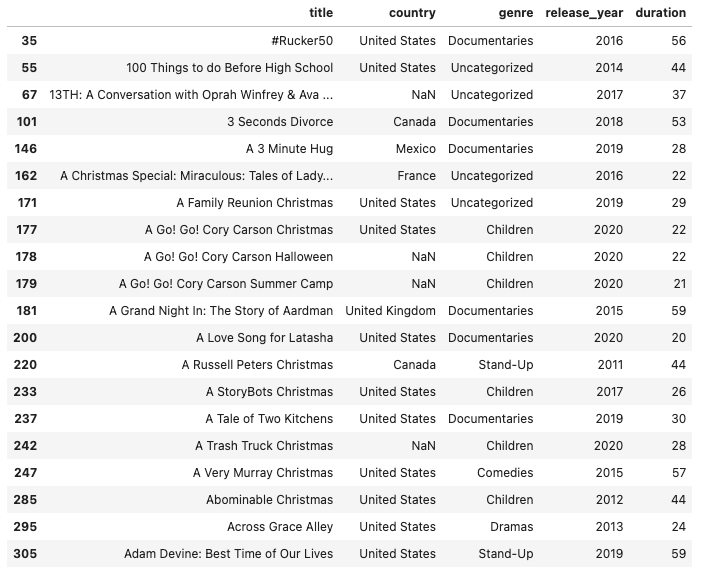
From the table shown above, we can see that movies that have a duration of fewer than 60 minutes fall into genres such as “Children”, “Stand-Up”, and “Documentaries”. We should trim them out by marking them with different colors than the others. In this code below, we will color “Children” movies with red, “Stand-Up” movies with green, and “Documentaries” movies with blue. Meanwhile, the rest of the movies will be black.

Since we’ve colored all the movies based on their genre, we can now re-plot our data and see what the new plot is like.
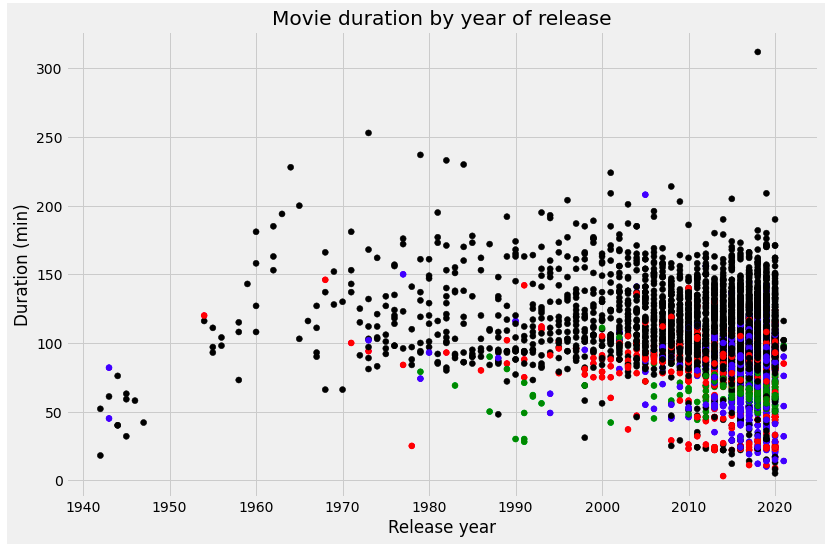
You can see from the previous plot that movies with short duration in recent decades are mostly those that fall into “Children”, “Stand-Up”, and “Documentaries” categories. So now, we can count them out and continue our analysis with more accurate data in knowing whether movie duration in recent years is decreasing or not.
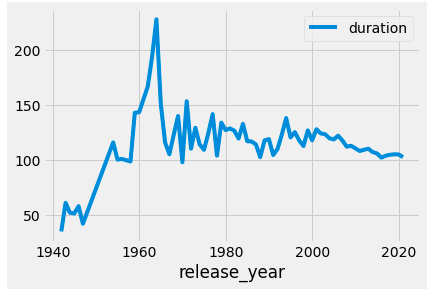
We have plotted the data and from the plot, we can see that the movie duration was trending up from 1940 to the first quarter of the 1960s but then it fluctuates afterward, even in recent years. Thus, from the analysis we’ve made, we can conclude that the speculation or hypothesis saying that the movie duration is decreasing in recent years is false since the movie duration fluctuates each year.
Simple Visualization of Poverty Overview in Indonesia using Matplotlib
Poverty has been becoming one of Indonesia's biggest problem all along. This article will show you the overview of it as well as the simple use of matplotlib for data plotting.
In data analytics, plotting is immensely important as it gives us insights from the data. There are various tools out there available for plotting. However, as python has been becoming the hottest programming language contemporarily — especially among data scientists, so I’m going to show you how to plot your data using the most eminent python library used for data plotting, matplotlib. Actually, at first I just wanted to make an article about Indonesia’s poverty year-by-year in visualization, but since I’ve been posting about python tutorials before, so why don’t I share the code too, right? Teehee.
Matplotlib is a prominent python library used for data plotting and it is among the most used ones. It is known for its reliability, convenience, and simplicity for plotting, though it might be not the prettiest one. You could plot your data just by typing a few lines of code and taadaa! you’ll get your data visualized. In this article, you will learn simple plotting using matplotlib as well as simple analysis (or maybe graph reading lmao) of the graph. Please note that the code in this article is just an example aimed to give you an overview of the matplotlib use for data plotting. You may adjust the code as you desire depending on how you want your data to be plotted. The next paragraphs will show you an example of data plotting using Indonesia’s poverty overview year-by-year data.
Import Modules
First things first, you need to import several modules. There are 3 modules used here; pandas, NumPy, and matplotlib. Pandas will be used for importing and utilizing the data file, NumPy will be used for generating array, and matplotlib will be used for data plotting, obviously. Teehee.
Import Data
Bring the data that you desire to plot into the code. We’re using pandas to import the data. In this code below, we open an excel file, so you may adjust the code depending on the type of file you open. Note that xls.parse(0) meaning we parse the first sheet on the excel file, and again you may adjust the code according to what you desire. tail up the data to print the last five data on the file to take a quick sight at the data composition.
output: 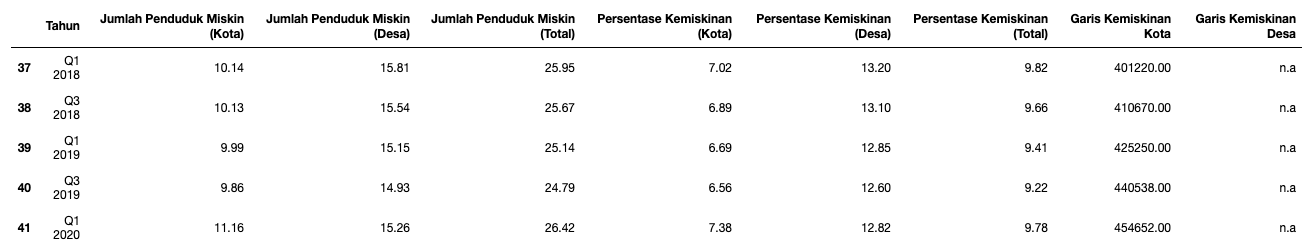
Data Plotting
Now that the data is already set, we’re about to plot the data immediately. In this particular case, we don’t need to clean up the data since the data is perfectly ready to use. In other cases, you may need to clean the data first before ultimately plotting it. The code below will plot the comparison of the total population living under the poverty line in Indonesia. From the output, we can see that the plot portraying a fluctuated graph meaning the number is going up and down for the past 9 years but more into climbdown in Q1 2017 up to Q3 2019. The graph went up again in Q1 2020, and it’s most probably affected by the COVID-19 pandemic.
output: 
The second plot portrays pretty much the same as the previous one but in percent. Here, I use a vertical bar plot so that we can compare the 3 parameters side-by-side. The graph depicted the same idea as the first graph.
output: 
Below is the plot of poverty line comparison in urban and village areas. Just so you know, the poverty line was divided into 2; urban and village up until 2017. I use the horizontal bar plot as it will be easier to compare and get insight from the parameters. From the graph, we can conclude that the poverty line threshold is constantly increasing year by year. It is expected as inflation affect the value of the money as well as the groceries’ prices.
output: 
The last plot is actually the same as the previous one. Since Q2 2017, the BPS (Indonesia’s Central Bureau of Statistics) website only shows one single poverty line threshold, and judging from the value, it was most likely generalized based on the previous urban threshold. So, in this code below we’re going to plot the urban poverty line threshold from Q1 2011 up until Q1 2017, extended with the general poverty line threshold from Q2 2017 up until Q1 2020. The output graph showing that the threshold is always increasing but the step-up percentage fluctuates until Q1 2018 — meanwhile you can see in Q3 2011 to Q1 2012 and Q3 2017 to Q1 2018 showing an almost flat horizontal graph meaning the climb-up rate is remarkably low. On another side, Q3 2018 to Q1 2020 showing an almost straight line meaning the climb-up rate is pretty much stable and constant.
output: 
So that was a simple graph plotting of Indonesia’s poverty overview year-by-year. It was just the simple one, you can explore matplotlib more — you can make interactive graphs and other interesting features with it more than I show you here, but still tho.. I do really hope this article was useful and that you could get a broad overview about the use of matplotlib for data plotting, hehe. Anyway, thank you for reading and don’t forget to always be healthy. ✨
Web Scraping with Python
Website is one of data resources. you can get informations from there. In this article you'll find out how to create an automated web scraper using Python.
The internet has been evolving so fast and massively since the past few years. The amount of internet users is increasing every day. There are tons of data created each day and it makes data becoming a thing nowadays. Data analytics is an important role now in many fields. In a company — for example; many companies demanding data analytics to size up certain decisions the company makes, like pricing. A company needs to put a reasonable price for the products and sometimes they need to compare the prices from its competitors. They could collect the competitors’ pricing data from websites, and that is where web scraping is spot-on at. Web Scraping is one of the scraping methods that you can choose to collect data from the internet. However, here you will learn how to build an automated web scraper with Python. This method will absolutely ease your work to gather information from websites as it is automated. Okay, enough chit chat. Get ready for it cause we’re about to start learning now!
What is web scraping?
Web scraping is a process where you collect or gather information from the internet (websites). There are several methods of web scraping, from the naive copy-paste method to the advanced one with an automated program. Web scraping is becoming more popular nowadays as the internet is becoming more massive too. There is a lot of information that we could get from the internet. People often gathering information from it for certain purposes, i.e. research or analysis. In this article, we will learn how to scrape and collect data from websites.
Why scrape the web?
Sometimes we face some situations where we need to surf the web back and forth to get information from it as much as we can — for example; buying something from an online marketplace. When we’re doing it, we usually scan every price and other details from the posted products as we’re looking for the most suitable product for us. In this case, it’s kind of inefficient to scan the web manually. Now that technology has evolved enormously, why don’t we use it to ease our work? Hold on a sec! You’re about to know how to build an automated web scraper with Python. Keep scrolling down!
In order to build an automated web scraper, you need to follow the steps below. There are several steps to do it:
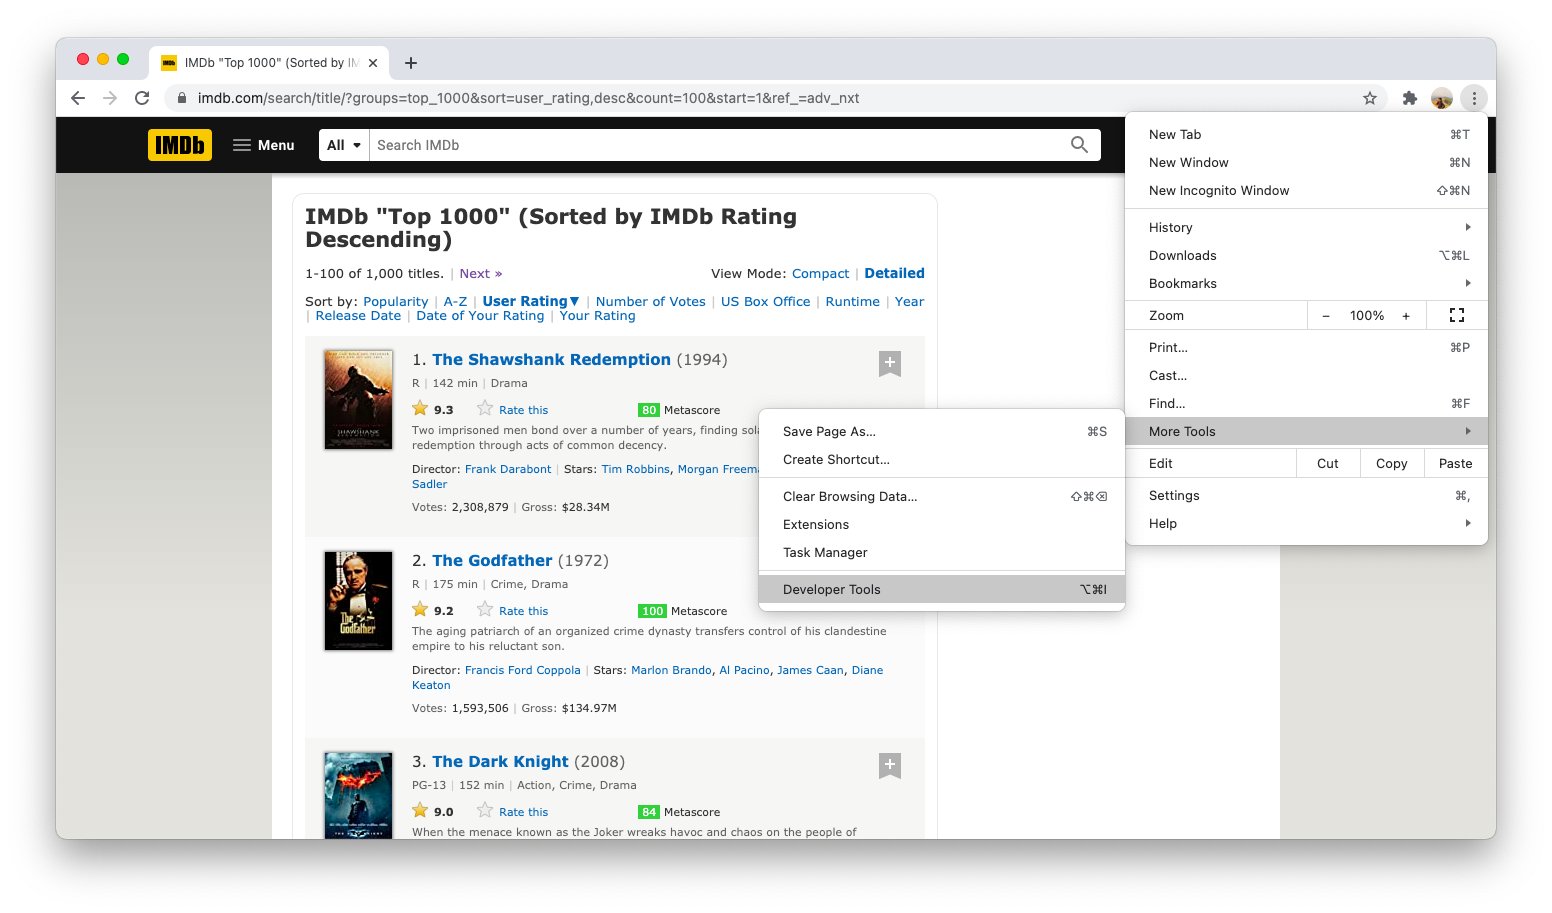
Step 1: Inspect the Website
Open the website that you desire to scrape from your favorite browser. Take a glimpse and try to analyze the structure of the website, then go to developer tools of your web browser. This one below is a picture of how you get into developer tools using Google Chrome.
Once you clicked the developer tools, the web inspector will be opened alongside the website you’re opening, like this picture below.
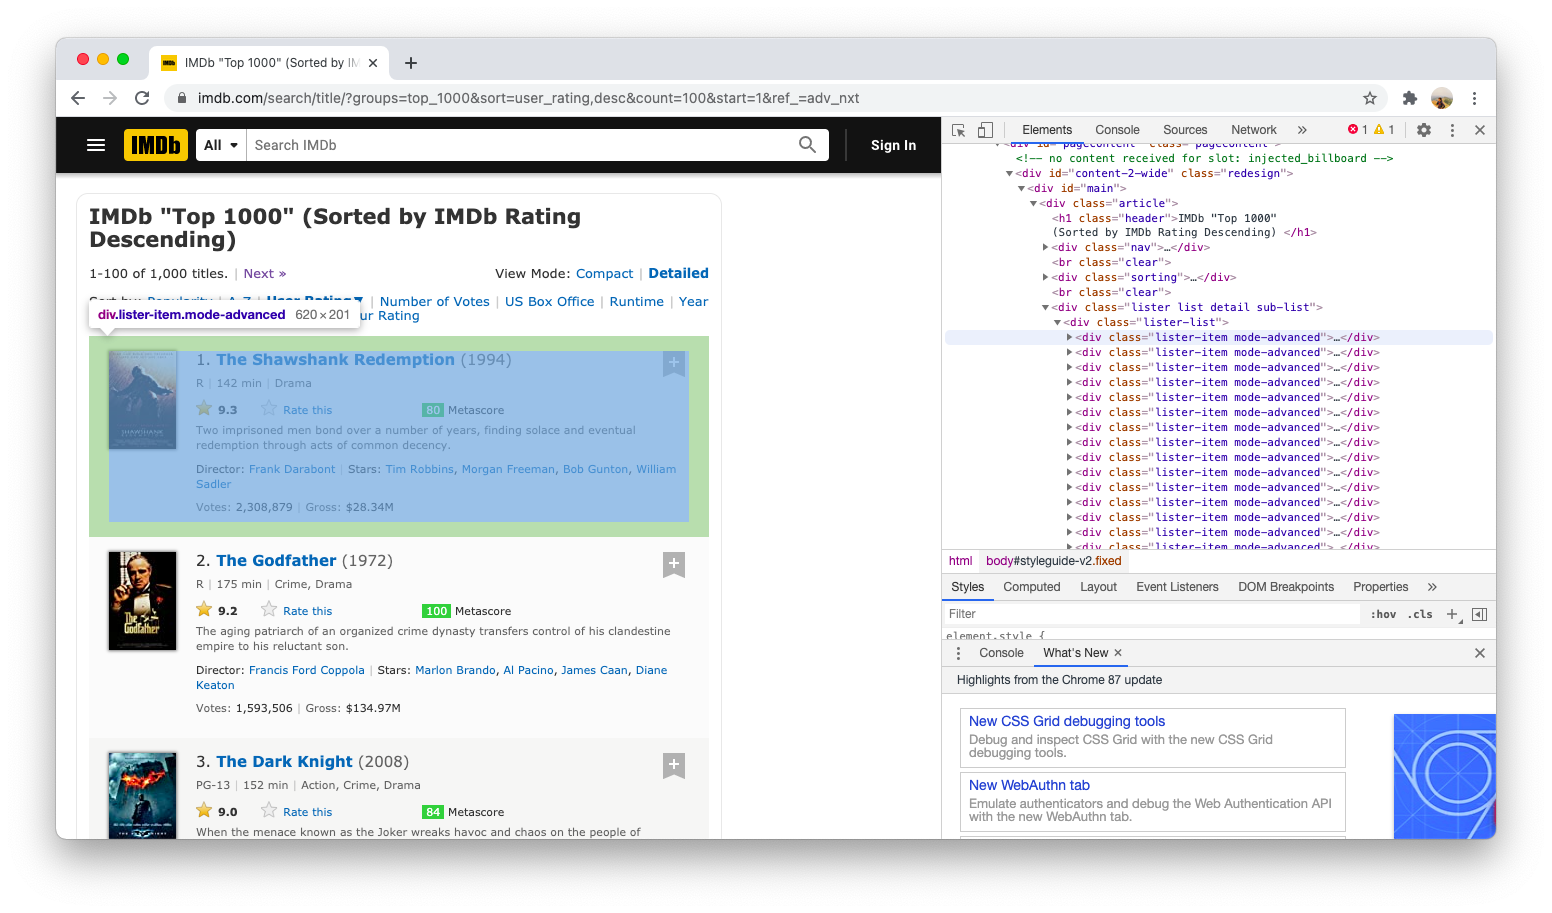
Scan through the HTML code to find the elements or tags that contain the data you want to collect from the website. You can hover every line of the code to find it as the browser will highlight the website’s element that represents the code you’re hovering to. Once you found it, take a sign on it as you will use it for the next step on your code.
Step 2: Scrape the Website using Selenium
Now, you can start coding to scrape the website. In this article, we will do it using Python, and the library that we will be using to scrape the website is Selenium. If you haven’t installed the library yet, you can install it first using pip command.
pip install selenium
Once it’s installed, we can use it to scrape the website you desire. But before doing that, you need to make sure that you have placed a browser driver on your computer. A browser driver is a driver that is exclusively used and controlled by selenium for scrapping purposes using a particular browser. You can look it up on the internet about how to install a browser driver on your computer but if you’re using Chrome, you can download ChromeDriver here.
Now that you are set, you can start using the selenium library on the code for scraping. Here is how you set your web scraper using selenium and ChromeDriver. Note that you can adjust the code below depending on what kind of browser driver you’re using.
from selenium import webdriver as wd

driver = wd.Chrome('path to your webdriver')
link = "the website link"
driver.get(link)
content = driver.page_source
Step 3: Parse the HTML code using BeautifulSoup4
Once you have scraped the web, now you need to highlight the information that you want to collect using the HTML tags you have got earlier in step 1. Note that selenium will return the HTML code and you will never store the HTML code as it’s messy and hard to read. You need to translate the HTML code, and this is where you need the BeautifulSoup4 library on your code. This library will parse the HTML code and return the information you need in text or string. If you haven’t installed this library yet, you can easily get one by executing this command below.
pip install beautifulsoup4
Now that it’s installed, you can now start using it to parse the HTML code. You can use the find function to find a specific HTML code. Specify the HTML code you want to get by inserting the HTML tag as a function parameter. The code below is an example of how.
from bs4 import BeautifulSoup

soup = BeautifulSoup(content)
example = soup.find(id = 'someHTML-ID')
If you want to scrape more data, you can use the findall function and it will return an iterable object that you can scrape information from. Keep in mind that the returned value is an object, so you need to do iteration and specify some specific information later on. You can get the text value from any specific tag with object.text. The code below is an example of how.
x = soup.findall('div', attrs={'class':'someHTML-Class'})
info_data = []
for i in x:
    info1 = x.find('span', attrs={'class':'someClass1'}))
    info2 = x.find('div', attrs={'class':'someClass2'}))
    info3 = x.find('span', attrs={'class':'someClass3'}))
    info_data.apppend([info1, info2, info3])
Now that you have reached this part of the article, roughly speaking we can say that you have known how to scrape data from the web. You have learned how to search HTML elements or tags that contain the information you want to scrape using the browser web inspector tools, how to scrape and get the website HTML code using selenium, and how to parse the HTML code to get the actual information using beautifulsoup4. You can take advantage of those and scrape the web. The program code might be slightly different depending on the website you desire to scrape, but if you want to know the actual example, you can visit my web scraping code on my GitHub repo here.
Twitter Data Cleaning using Python
Twitter data contains a bunch of attributes, such as tweets, accounts, dates, and etc. Most likely, Twitter data contains unnecessary things that need to be cleaned. But how could you clean Twitter data?
Twitter is one of the most used data sources for data analysis. The reason is that it’s open and free to collect unless you subscribe to the paid version one. Besides, it’s pretty simple to collect data from it. If you haven’t known how to collect Twitter data using python, you can check my previous post, teehee.
Twitter data contains a bunch of information parameters. Sometimes, the data contain unnecessary things that need to be cleaned, such as unnecessary characters, links, newlines, and other kinds of stuff. In this article, I’m going to show you how to clean Twitter data using the python programming language.
Import Modules
Firstly, you need to import the modules needed. We’re going to use 4 modules here:
- Pandas, to open data files and to apply certain operations to the data.
- Html, to decode HTML entities into regular characters.
- Re, to filter and delete unnecessary links, hash, username, punctuations or whatever you wish.
- Nltk, to clean stopwords.
import pandas as pd
import html
import re
from nltk.corpus import stopwords
from nltk.tokenize import word_tokenize
Import the Data
Secondly, we need to import the Twitter data. in this case, I use CSV Twitter data, you may adjust the code if you use another extension type of file. We’re taking advantage of the pandas library here to import the data.
pd.set_option('display.max_colwidth', None)
data = pd.read_csv('your_sample.csv')
data.head()
Drop Data Duplicates
Once we have imported the data, we’re now ready for the data cleaning process. The first thing that we’re going to clean are data duplicates. Most of the time, we don’t need the data duplicates, because in further use (i.e. analysis) these data duplicates could mess up the result by messing up the measurement.
new_data = data.drop_duplicates('Tweet Content',keep='first') #delete the duplicates by dropping them and store the result value to a new variable
new_data.head()
Store the New Dataframe into a New Data File
If your data has indices included on it, once you drop those data duplicates, you need to store the new data in a new file. Don’t forget to store the new data to a new file without including the index on it, so that we could explore the data more freely later on.
We’re here assuming that we’re only going to use the tweets data, so we’re going to extract the tweets data out of the file.
new_data.to_csv(r'your_new_sample.csv', index = False)
new_sample = pd.read_csv('your_new_sample.csv')
new_sample.head()
tweets = new_sample['Tweet Content']
tweets.head()
Decode HTML entities and Clean Newlines
Once we extracted tweet data, we’ll notice things that need to be cleaned. Most of the time, the tweets data returned by Twitter JSON data contain HTML entities and they need to be decoded into characters. So, we’re cleaning them using html library. Apart from that, we also need to clean up newlines since they make the data messy.
for i in range (len(tweets)):
    x = tweets[i].replace("\n"," ") #cleaning newline "\n" from the tweets
    tweets[i] = html.unescape(x)
tweets.head()
Remove Unnecessary Stuffs using RegEx
Sometimes when tweeting, Twitter users will attach media like pictures, videos, etc. Those media will be converted into links on the JSON data. Since we’re only going to be using the text data, which is the tweets, so we need to clean up the links. Also, we will clean up hash characters (only the hash characters not the whole hashtags) and username. All those things will be cleaned using the regex Python library.
for i in range (len(tweets)):
    tweets[i] = re.sub(r"(@[A-Za-z0-9_]+)|[^\w\s]|#|http\S+", "", tweets[i])
tweets.head()
Remove Stopwords
Up till now, we already got much cleaner data, but there is one more thing that we need to do to make it even cleaner. In text-data, mostly it contains insignificant words that are not used for the analysis process because they could mess up the analysis score. So, we’re about to clean them now using the nltk Python library. There are several steps you need to do to remove the stopwords:
- Preparing stopwords
tweets_to_token = tweets sw = stopwords.words('english') #you can adjust the language as you desire sw.remove('not') #we exclude not from the stopwords corpus since removing not from the text will change the context of the text - Tokenize the tweets
for i in range(len(tweets_to_token)): tweets_to_token[i] = word_tokenize(tweets_to_token[i]) - Remove the Stopwords
for i in range(len(tweets_to_token)):
 tweets_to_token[i] = [word for word in tweets_to_token[i] if not word in sw]
tweets_to_token
So, that’s pretty much all about how to clean your Twitter data. I hope it was helpful and enlightening. Thank you guys for reading! Bye for now and don’t forget to always to keep an eye on your health! 👋🏻😉
Collecting Twitter Data using Python
Twitter data is widely used for analysis. There are lots of insight we could get from it, but how could you actually collect all those Twitter data tho? Click me to find out!
Twitter is a microblogging service or also called social media where you can tweet out your thoughts within 280 characters. It is used by 330 million people across the world and there are 500 million tweets sent per day. That means, there are a lot of data we could get too as a data geek, teehee 😁. Luckily, Twitter allows us to collect data from it for certain purposes. So, for us who want to do research and need Twitter data for it, we can actually ask Twitter for consent and ultimately get those data through Twitter API. But how could we literally do all that, tho?
To collect Twitter data through Twitter API, we need to apply for permission first. You can look it up on the internet about how to do it, and don’t you worry about it, because trust me it is REALLY simple 😗. You just have to register your regular Twitter account into a Twitter developer account, answer several questions, and poof!! you’ll get the credentials in a snap.
Import Modules
After you got your own Twitter developer account, the next step you need to do is coding. We’re going to be using Python programming language for this. To scrape the Twitter data, we need tweepy and pandas (optional) libraries. Tweepy library is used to connect to the API and to collect the data we needed, while pandas library is used to store the Twitter data into a file just in case for further use.
import tweepy as tw
import pandas as pd
Define Your Twitter Developer Credentials
In order to connect to Twitter API, we need to define our credentials first. There are 4 credentials you need to define, they are API key, API secret key, access token, and access token key. You can get all those 4 keys from your Twitter developer account page. Once you got the keys, you can put them into the code, like this one below.
api_key = 'YOUR_API_KEY'
api_secret_key = 'YOUR_API_SECRET_KEY'
access_token = 'YOUR_ACCESS_TOKEN'
access_token_secret = 'YOUR_ACCESS_TOKEN_SECRET'

auth = tw.OAuthHandler(api_key, api_secret_key)
auth.set_access_token(access_token, access_token_secret)
api = tw.API(auth, wait_on_rate_limit=True, wait_on_rate_limit_notify=True)
Collect the Data
You are already connected to the Twitter API and now you can scrape data through it. First things first, you need to decide the keyword of the tweet that you want to collect and define other parameters if required. There are a bunch of information parameters that you will get from the JSON data Twitter give you, but in this code, we’re going to extract these parameters:
- User screen name
- Tweet
- Retweets count
- Likes count
- Tweet’s location
- Source of Tweet
- Account’s verified status
- Account’s date of creation
- Profile image attachment
- Bio attachment
- Statuses count
- Followings count
- Followers count
- Account’s location
And here is the code we need to do that. Note that you can adjust the code depending on your needs.
key_words = "insert your keyword here"

search_result = tw.Cursor(api.search,
              q=key_words,
              lang="id",
              truncated=True).items(10)

crawling_result = [api.get_status(data.id, tweet_mode="extended") for data in search_result]

tweet_list = [[status.user.screen_name, status.full_text, status.retweet_count, status.favorite_count, status.geo, status.source, status.user.verified, status.author.created_at, status.author.default_profile_image, status.author.default_profile, status.user.statuses_count, status.user.friends_count, status.user.followers_count, status.user.location] for status in crawling_result]
Convert the Data into a Pandas Dataframe
Next step, we will convert the data into a pandas data frame. This step is intended to convert the data into a neater and easier to read one. And also, since we’re going to store the data into a file, so we better convert it into a data frame cause the data storing process will be easier by doing so and we’ll get more organized data too.
tweet_df = pd.DataFrame(data = tweet_list,
                    columns=["username", "tweet", "retweet_count", "like_count", "location", "device", "verified_status", "acc_creation_date","no_profile_pic", "no_bio", "tweets_count", "followings_count", "followers_count", "user_location"])
tweet_df
Store the Dataframe into a File
Last but not least, we’ll be storing the data in a file. In this code, we’re going to store it into a CSV file. You can store it into whatever extension type file by adjusting the code. The storing process is done just in case for further use of the data.
tweet_df.to_csv(r'twitter_data_collection.csv', index=False)
And that was pretty much all about how you collect Twitter data through Twitter API. How was it? It was really simple, right? I hope so, teehee. I thank you guys for reading this article and I hope it helped you (hopefully lol). Bye for now and take care of your health, guys! ✨